Power BI
Humble beginnings
Redprism came a long way intending to ‘Transform the Career and Lives’ of the individuals in the competitive world and up skilling their career, and creating a balance between the learning and implementing the real-time cases in education and achieve the dreams.
Power BI
What is Power BI?
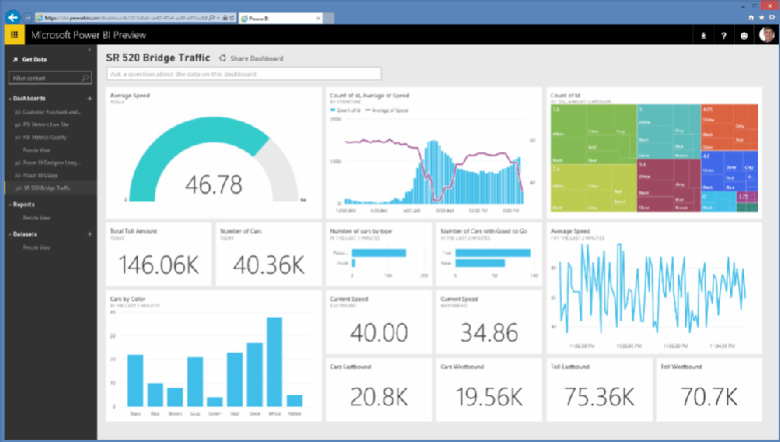
Microsoft Power BI is a collection of business analytics tools which is used to implement ELT(Extract and Load Transform data), Analytics can be done with Power BI Modeling and Reports will be created with various visualizations and publish them throughout your organization. Power BI can take data from hundreds of data sources, simplify data prep, and drive ad hoc analysis. We can create beautiful customized reports then we can publish reports to either Power BI Services which is running on Cloud or Power BI Reporting Server which is running on Premise. Business Users can access the reports across Web and Mobile devices. Everyone can create personalized dashboards with a unique, 360-degree view of their business. And scale across the enterprise, with governance and security built-in.
What you will achieve after Power BI training at Redprism?
ü To change the messy data into the right visualization format.
ü It makes the projects easily in lesser time.
ü You can also improve strategies for different data which makes you a good decision maker.
ü It helps you with your career growth to the next level.
ü You can generate valuable data for yourself and your company in the right order format to understand easily.
ü You can create Power BI dashboards in no time.
Exclusive Key Factors at Redprism:-
REDPRISM is providing the best POWER BI Training in Noida with most experienced professionals. Our trainers are working in POWER BI Training and related technologies for more than 10 years in MNC’s. We are offering POWER BI Training Classes in Noida as well as online around the globe. We framed our syllabus to match with the real world requirements for both beginner level to advanced level. POWER BI Training Classes in Noida conducting in week day, week end both morning and evening batches based on participant’s requirement. We do offer Fast-Track POWER BI Training Noida and also One-to-One POWER BI Training in Noida. Our participants will be eligible to clear all type of interviews at end of our sessions. Our POWER BI Training classes in Redprism focused on assisting in placements as well. Our POWER BI Training Course Fees is very affordable compared to others. Our Training Includes POWER BI Training Real Time Classes Noida, POWER BI Training Live Classes, POWER BI Training Real Time Scenarios.
Prime Features why to Join Red Prism?:-
· Industry Expert Trainers with 10-15 years of experience.
· Course content is designed by best Subject Matter Experts.
· Practical Assignments.
· Real Time Projects.
· Video recording of each and every session.
· Yours doubts are clarified by 24*7 assistance with our experts.
· We conduct regular Mock tests and certifications at the end of course.
· Certification Guidance.
· Recognized training complete certificate.
· 100% Placement Assistance.
· Less fees as compared to other institutes.
· Flexi payment options
· Scholarship Available
Course Content:-
§ Introduction to Power BI – Need, Importance
§ Power BI – Advantages and Scalable Options
§ History – Power View, Power Query, Power Pivot
§ Power BI Data Source Library and DW Files
§ Cloud Collaboration and Usage Scope
§ Business Analyst Tools, MS Cloud Tools
§ Power BI Installation and Cloud Account
§ Power BI Cloud and Power BI Service
§ Power BI Architecture and Data Access
§ On Premise Data Access and Microsoft On Drive
§ Power BI Desktop – Installation, Usage
§ Sample Reports and Visualization Controls
§ Power BI Cloud Account Configuration
§ Understanding Desktop & Mobile Editions
§ Report Rendering Options and End User Access
§ Power View and Power Map. Power BI Licenses
§ Course Plan – Power BI Online Training
§ Report Design with Legacy & .DAT Files
§ Report Design with Database Tables
§ Understanding Power BI Report Designer
§ Report Canvas, Report Pages: Creation, Renames
§ Report Visuals, Fields and UI Options
§ Experimenting Visual Interactions, Advantages
§ Reports with Multiple Pages and Advantages
§ Pages with Multiple Visualizations. Data Access
§ PUBLISH Options and Report Verification in Cloud
§ “GET DATA” Options and Report Fields, Filters
§ Report View Options: Full, Fit Page, Width Scale
§ Report Design using Databases & Queries
§ Query Settings and Data Preloads
§ Navigation Options and Report Refresh
§ Stacked bar chart, Stacked column chart
§ Clustered bar chart, Clustered column chart
§ Adding Report Titles. Report Format Options
§ Focus Mode, Explore and Export Settings
§ Power BI Design: Canvas, Visualizations and Fields
§ Import Data Options with Power BI Model, Advantages
§ Direct Query Options and Real-time (LIVE) Data Access
§ Data Fields and Filters with Visualizations
§ Visualization Filters, Page Filters, Report Filters
§ Conditional Filters and Clearing. Testing Sets
§ Creating Customized Tables with Power BI Editor
§ General Properties, Sizing, Dimensions, and Positions
§ Alternate Text and Tiles. Header (Column, Row) Properties
§ Grid Properties (Vertical, Horizontal) and Styles
§ Table Styles & Alternate Row Colors – Static, Dynamic
§ Sparse, Flashy Rows, Condensed Table Reports. Focus Mode
§ Totals Computations, Background. Borders Properties
§ Column Headers, Column Formatting, Value Properties
§ Conditional Formatting Options – Color Scale
§ Page Level Filters and Report Level Filters
§ Visual-Level Filters and Format Options
§ Report Fields, Formats and Analytics
§ Page-Level Filters and Column Formatting, Filters
§ Background Properties, Borders and Lock Aspect
§ CHART Report Types and Properties
§ STACKED BAR CHART, STACKED COLUMN CHART
§ CLUSTERED BAR CHART, CLUSTERED COLUMN CHART
§ 100% STACKED BAR CHART, 100% STACKED COLUMN CHART
§ LINE CHARTS, AREA CHARTS, STACKED AREA CHARTS
§ LINE AND STACKED ROW CHARTS
§ LINE AND STACKED COLUMN CHARTS
§ WATERFALL CHART, SCATTER CHART, PIE CHART
§ Field Properties: Axis, Legend, Value, Tooltip
§ Field Properties: Color Saturation, Filters Types
§ Formats: Legend, Axis, Data Labels, Plot Area
§ Data Labels: Visibility, Color and Display Units
§ Data Labels: Precision, Position, Text Options
§ Analytics: Constant Line, Position, Labels
§ Working with Waterfall Charts and Default Values
§ Modifying Legends and Visual Filters – Options
§ Map Reports: Working with Map Reports
§ Hierarchies: Grouping Multiple Report Fields
§ Hierarchy Levels and Usages in Visualizations
§ Preordered Attribute Collection – Advantages
§ Using Field Hierarchies with Chart Reports
§ Advanced Query Mode @ Connection Settings – Options
§ Direct Import and In-memory Loads, Advantages
§ Hierarchies and Drilldown Options
§ Hierarchy Levels and Drill Modes – Usage
§ Drill-thru Options with Tree Map and Pie Chart
§ Higher Levels and Next Level Navigation Options
§ Aggregates with Bottom/Up Navigations. Rules
§ Multi Field Aggregations and Hierarchies in Power BI
§ DRILLDOWN, SHOWNEXTLEVEL, EXPANDTONEXTLEVEL
§ SEE DATA and SEE RECORDS Options. Differences
§ Toggle Options with Tabular Data. Filters
§ Drilldown Buttons and Mouse Hover Options @ Visuals
§ Dependant Aggregations, Independent Aggregations
§ Automated Records Selection with Tabular Data
§ Report Parameters : Creation and Data Type
§ Available Values and Default values. Member Values
§ Parameters for Column Data and Table / Query Filters
§ Parameters Creation – Query Mode, UI Option
§ Linking Parameters to Query Columns – Options
§ Edit Query Options and Parameter Manage Entries
§ Connection Parameters and Dynamic Data Sources
§ Synonyms – Creation and Usage Options
§ Understanding Power Query Editor – Options
§ Power BI Interface and Query / Dataset Edits
§ Working with Empty Tables and Load / Edits
§ Empty Table Names and Header Row Promotions
§ Undo Headers Options. Blank Columns Detection
§ Data Imports and Query Marking in Query Editor
§ JSON Files & Binary Formats with Power Query
§ JavaScript Object Notation – Usage with M Lang.
§ Applied Steps and Usage Options. Revert Options
§ creating Query Groups and Query References. Usage
§ Query Rename, Load Enable and Data Refresh Options
§ Combine Queries – Merge Join and Anti-Join Options
§ Combine Queries – Union and Union All as New Dataset
§ M Language : NestedJoin and JoinKind Functions
§ REPLACE, REMOVE ROWS, REMOVE COL, BLANK – M Lang
§ Column Splits and FilledUp / FilledDown Options
§ Query Hide and Change Type Options. Code Generation
§ Invoke Function and Freezing Columns
§ Creating Reference Tables and Queries
§ Detection and Removal of Query Datasets
§ Custom Columns with Power Query
§ Power Query Expressions and Usage
§ Blank Queries and Enumeration Value Generation
§ M Language Semantics and Syntax. Transform Types
§ IF..ELSE Conditions, TransformColumn() Types
§ RemoveColumns(), SplitColumns(),ReplaceValue()
§ Table. Distinct Options and GROUP BY Options
§ Table. Group(), Table. Sort() with Type Conversions
§ PIVOT Operation and Table. Pivot(). List Functions
§ Using Parameters with M Language (Power Query Editor)
§ Advanced Query Editor and Parameter Scripts
§ List Generation and Table Conversion Options
§ Aggregations using PowerQuery & Usage in Reports
§ Report Generation using Web Pages & HTML Tables
§ Reports from Page collection with Power Query
§ Aggregate and Evaluate Options with M Language
§ Creating high-density reports, ArcGIS Maps, ESRI Files
§ Generating QR Codes for Reports
§ Table Bars and Drill Thru Filters
§ Purpose of Data Analysis Expressions (DAX)
§ Scope of Usage with DAX. Usability Options
§ DAX Context : Row Context and Filter Context
§ DAX Entities : Calculated Columns and Measures
§ DAX Data Types : Numeric, Boolean, Variant, Currency
§ Datetime Data Type with DAX. Comparison with Excel
§ DAX Operators & Symbols. Usage. Operator Priority
§ Parenthesis, Comparison, Arithmetic, Text, Logic
§ DAX Functions and Types: Table Valued Functions
§ Filter, Aggregation and Time Intelligence Functions
§ Information Functions, Logical, Parent-Child Functions
§ Statistical and Text Functions. Formulas and Queries
§ Syntax Requirements with DAX. Differences with Excel
§ Naming Conventions and DAX Format Representation
§ Working with Special Characters in Table Names
§ Attribute / Column Scope with DAX – Examples
§ Measure / Column Scope with DAX – Examples
§ YTD, QTD, MTD Calculations with DAX
§ DAX Calculations and Measures
§ Using TOPN, RANKX, RANK.EQ
§ Computations using STDEV & VAR
§ SAMPLE Function, COUNTALL, ISERROR
§ ISTEXT, DATEFORMAT, TIMEFORMAT
§ Time Intelligence Functions with DAX
§ Data Analysis Expressions and Functions
§ DATESYTD, DATESQTD, DATESMTD
§ ENDOFYEAR, ENDOFQUARTER,ENDOFMONTH
§ FIRSTDATE, LASTDATE, DATESBETWEEN
§ CLOSINGBALANCEYEAR,CLOSINGBALANCEQTR
§ SAMEPERIOD and PREVIOUSMONTH,QUARTER
§ KPIs with DAX. Vertipaq Queries in DAX
§ IF..ELSEIF.. Conditions with DAX
§ Slicing and Dicing Options with Columns, Measures
§ DAX for Query Extraction, Data Mash up Operations
§ Calculated Columns and Calculated Measures with DAX
§ PowerBI Report Validation and Publish
§ Understanding PowerBI Cloud Architecture
§ PowerBI Cloud Account and Workspace
§ Reports and Dataset Items Validation
§ Dashboards and Pins – Real-time Usage
§ Dynamic Data Sources and Encryptions
§ Personal and Organizational Content Packs
§ Gateways, Subscriptions, Mobile Reports
§ Data Refresh with Power BI Architecture
§ PBIX and PBIT Files with Power BI – Usage
§ Visual Data Imports and Visual Schemas
§ Cloud and On-Premise Data Sources
§ How PowerBI Supports Data Model?
§ Relation between Dashboards to Reports
§ Relation between Datasets to Reports
§ Relation between Datasets to Dashboards
§ Page to Report – Mapping Options
§ Publish Options and Data Import Options
§ Need for PINS @ Visuals and PINS @ Reports
§ Need for Data Streams and Cloud Integration
§ Report Publish Options and Verifications
§ Working with Power BI Cloud Interface & Options
§ Navigation Paths with “My Workspace” Screens
§ FILE, VIEW, EDIT REPORTS, ACCESS, DRILLDOWN
§ Saving Reports into pdf, pptx, etc. Report Embed
§ Report Rendering and EDIT, SAVE, Print Options
§ Report PIN and individual Visual PIN Options
§ Create and Use Dashboards. Menu Options
§ Go to Dashboard and Go to LIVE Page Options
§ Operations on Pinned Reports and Visuals
§ TITLE, MEDIA, USAGE METRICS & FAVOURITES
§ SUBSCRIPTION Options and Reports with Mobile View
§ Options with Report Page : Print and Subscribe
§ Report Actions: USAGE METRICS, ANALYSE IN EXCEL
§ Report Actions: RELATED ITEMS, RENAME, DELETE
§ Dashboard Actions: METRICS, RELATED ITEMS
§ Dashboard Actions: SETTINGS FOR Q & A, DELETE
§ PIN Actions: METRICS, SHARE, RELATED ITEMS
§ PIN Actions: SETTINGS FOR Q & A, DELETE
§ EDIT DASHBOARD (CLOUD), On-The-Fly Reports
§ Dataset Actions: CREATE REPORT, REFRESH
§ SCHEDULED REFRESH & RELATED ITEMS
§ Dashboard Integration with Apps in Power BI
§ Publish PowerBI Report Templates
§ Import and Export Options with Power BI
§ Dataset Navigations and Report Navigations
§ Quick Navigation Options with “My Workspace”
§ Dashboards, Workbooks, Reports, Datasets
§ Working with MY WORK SPACE group
§ Installing the Power BI Personal Gateway
§ Automatic Refresh – Possible Issues
§ Adding images to the dashboards
§ Reading & Editing Power BI Views
§ Power BI Templates (pbit)- Creation, Usage
§ Managing report in Power BI Services
§ PowerBI Gateway – Download and Installation
§ Personal and Enterprise Gateway Features
§ PowerBI Settings : Dataset – Gateway Integration
§ Configuring Dataset for Manual Refresh of Data
§ Configuring Automatic Refresh and Schedules
§ Workbooks and Alerts with Power BI
§ Dataset Actions and Refresh Settings with Gateway
§ Using natural Language Q&A to data
§ Data Navigation Paths and Data Splits
§ Getting data from existing systems
§ Data Refresh and LIVE Connections
§ pbit and pbix : differences. Usage Options
§ Quick Insights For Power BI Reports
§ Quick Insights For PowerBI Dashboards
§ Generating Insights with Cloud Datasets
§ Generating Reports with Cloud Datasets
§ Using relational databases on-premises
§ Using relational databases in the cloud
§ Consuming a service content pack
§ Creating a custom data set from a service
§ Creating a content pack for your organization
§ Consuming an organizational content pack
§ Updating an organizational content pack
§ Adding Tiles : Images, Videos, Data Streams
§ Creating New Reports from Cortana, Advantages
§ SSRS Integration with Power BI
§ SSRS Report Portal URL to Power BI Cloud
§ Power BI KPI Reports Vs SSRS KPI Reports
§ Converting and Working with Mobile Reports
§ Report Builder Reports to Power BI
§ Generating QR Codes and Report Security
§ Reporting JSON Files, Bulk Data Loads
§ Creating high-density Reports in Power BI
§ OLAP Data Sources in Power BI
§ Using MDX Queries with PowerBI Queries
§ MDX SELECT and Perspective Access
§ KPIs and MDX Expressions with Power BI
§ MDX Queries and Filters with Power BI
§ Linked Servers and T-SQL SPROCs with MDX
§ YTD, PARALLELPERIOD,SCOPE, ALLMEMBERS
§ WHERE, EXCEPT, RANGE, NONEMPTY
§ CURRENT & EMPTY, AND / OR, LEFT / RIGHT
§ Implementing Row Level Security (RLS)
§ Security Roles and Role Members. Tests
§ Using R for Power BI, Streaming Datasets
§ Azure Connections with PowerBI Desktop
§ PowerBI Reports using SQL Azure DBs